Project - Light Scanner
Build a servo and light sensor scanner in Snakie that sweeps a half circle, measures with three instruments at once, logs to CSV and points at the brightest spot
By Kevin McAleer, 6 Minutes
Page last updated November 20, 2026

Time to use everything at once. We’ll build a scanner: a light sensor on a servo that sweeps half a circle, measures the brightness in every direction, and then turns to face the brightest one.
It’s the heart of a light-seeking robot and a sun-tracking solar panel. And it’s a great instrument workout, because there’s a signal, a sensor and a result to watch.
The plan
| Step | What happens | Instrument |
|---|---|---|
| 1 | Turn the servo to an angle | Oscilloscope shows the servo pulse |
| 2 | Wait for it to arrive | |
| 3 | Read the light sensor | Multimeter shows the volts |
| 4 | Plot and log the reading | Plotter draws the scan, file keeps it |
| 5 | Remember the brightest so far | |
| 6 | After the sweep, point at the brightest | Console prints the answer |
The hardware
On the simulated device you need nothing. For a real build:
| Part | Connect to |
|---|---|
| Servo signal (orange or yellow) | GP15 |
| Servo power (red) | VBUS, the 5 V pin |
| Servo ground (brown or black) | GND |
| Light sensor, one leg | 3V3 |
| Light sensor, other leg | GP26 |
| 10 kΩ resistor | From GP26 to GND |
The photoresistor and the fixed resistor make a voltage divider. More light means less resistance in the sensor, which pulls GP26 closer to 3.3 V. So brighter is a higher voltage.
Tape the sensor to the servo horn so it looks outwards. If you’ve taken Wire It Up, lay this circuit out in the Electronics workspace first and run the rules check.
The program
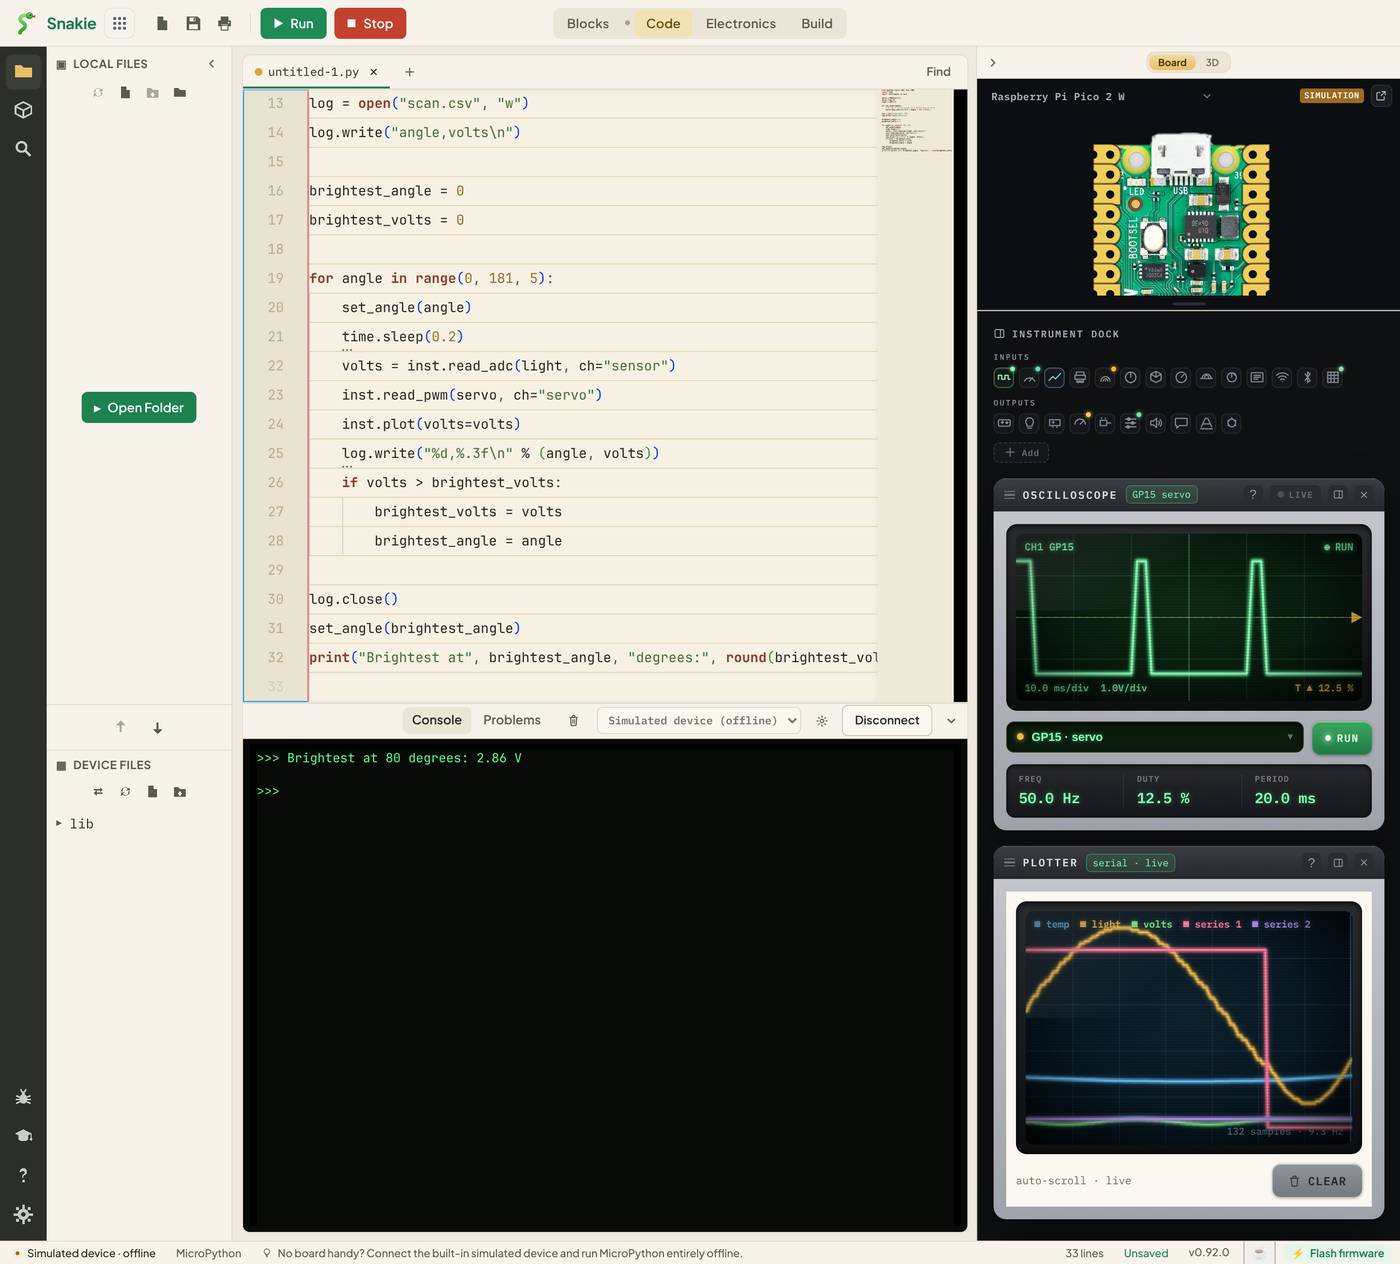
Open the Oscilloscope, Multimeter and Plotter, then run this in the full app.
How it works
Angles to pulses. set_angle() turns an angle into a duty value. A servo wants a 0.5 ms pulse for 0° and 2.5 ms for 180°, out of a 20 ms period. As a fraction of 65535 that’s 1638 to 8191, and the function slides between them.
Settle, then measure. time.sleep(0.2) gives the servo time to arrive. Read too early and you measure a direction the sensor has already left.
Three instruments, three lines.
volts = inst.read_adc(light, ch="sensor")   # Multimeter, and the value
inst.read_pwm(servo, ch="servo")            # Oscilloscope
inst.plot(volts=volts)                      # Plotter
Keeping the best. The if compares each reading with the best so far. When it’s beaten, both the reading and its angle are remembered. This “running maximum” is one of the most useful patterns in robotics.
The record. Every reading goes into scan.csv as well, using the file code from lesson 8.
What to look at
- Oscilloscope: choose GP15 · servo. FREQ stays at 50.0 Hz while DUTY climbs from about 2.5 % to 12.5 % as the sensor turns. The pulse visibly widens
- Multimeter: choose the sensor channel. When the sweep ends, MAX should match the voltage in the console
- Plotter: the
voltsline is the scan. The peak of the curve is the brightest direction - Console: on the simulated device you’ll see something like
Brightest at 80 degrees: 2.86 V
Then double-click scan.csv under Device Files. There are 37 rows, one for every 5° from 0 to 180, and the top of the volts column gives the same maximum. Three instruments and a file all agree. That’s what trusting your measurements feels like.
Debugging with instruments
Break it on purpose and see which instrument tells you.
| Break it like this | Which instrument shows it? |
|---|---|
Delete servo.freq(50) |
Oscilloscope: FREQ is wrong |
Change time.sleep(0.2) to 0.001 on real hardware |
Plotter: the scan is smeared |
Read ADC(27) instead of ADC(26) |
Multimeter: a reading that ignores the light |
Remove log.close() |
Data View: missing rows |
Try it Yourself
- Make the scan finer: step by 2° instead of 5°. How many rows should the file have now?
- Find the darkest direction as well, and print both.
- Sweep back from 180° to 0° after the first pass and plot both passes. Do they agree? On a real servo, the difference tells you how much slack is in its gears.
- Wrap it all in a
while True:loop so the scanner keeps tracking a moving torch.
Common Issues
Problem: The servo twitches or the Pico resets on real hardware. Solution: Power the servo from its own 5 V supply, with the grounds joined. Why: A servo starting to move draws a burst of current that can drag the Pico’s supply down.
Problem: The reading barely changes as the sensor turns. Solution: Check the 10 kΩ resistor goes from GP26 to GND, and try the scan in a darker room with a torch. Why: Without the resistor there’s no voltage divider, and in even light every direction looks the same.
Problem: The plot has extra lines.
Solution: Press CLEAR before the run and read the line called volts.
Why: The simulated device’s demo streams share the Plotter.
Problem: scan.csv doesn’t appear.
Solution: Wait for the program to finish, then refresh the Device Files panel.
Why: The file is only complete once log.close() has run.
Check your understanding
Quick quiz 1 of 3
Why is there a short sleep after set_angle()?
Quick quiz 2 of 3
Which instrument proves the servo signal is correct?
Quick quiz 3 of 3
What does the “running maximum” pattern remember?
You can use the arrows ← → on your keyboard to navigate between lessons.
Comments