The Plotter
Chart values from a running MicroPython program with Snakie's Plotter and learn to read trends, compare series and spot problems
By Kevin McAleer, 4 Minutes
Page last updated November 20, 2026

The Plotter is the instrument you’ll reach for most. If a number changes over time, plot it.
A chart recorder
The Plotter is a scrolling chart. Each time your program sends a value, the line moves one step to the right. Old readings slide off the left.
Open the Plotter in the dock, then run this in the full app. It pretends to be two thermometers, one indoors and one outside.
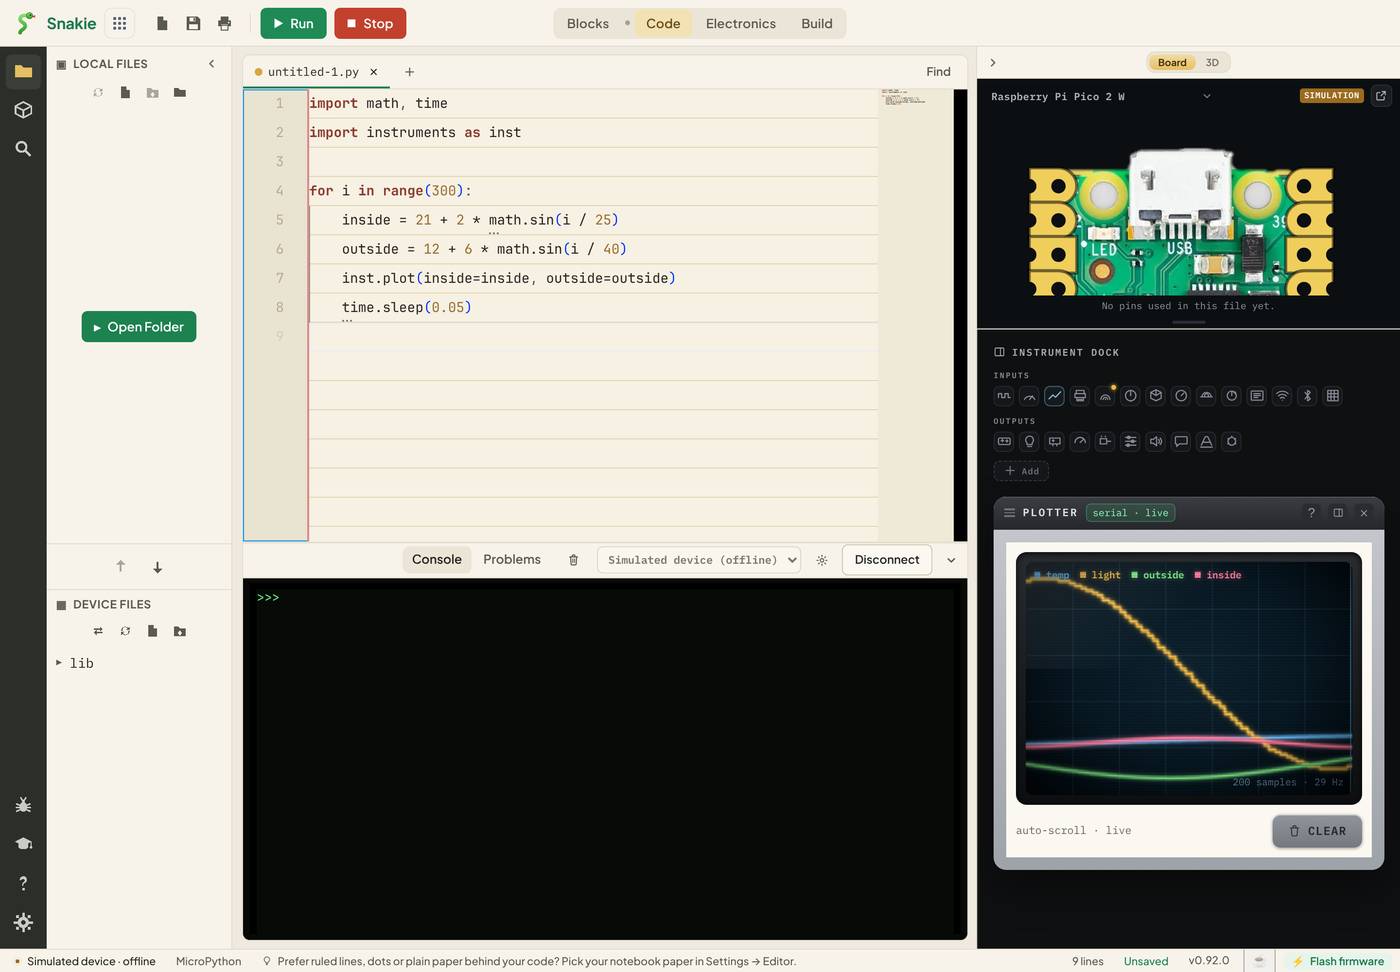
Reading the screen
- The legend along the top lists every series by name, each with its own colour
- The chart scales itself so the highest and lowest readings always fit
- The small print at the bottom corner shows how many samples are on screen and how fast they’re arriving
- CLEAR wipes the chart and starts again
The Plotter keeps the most recent 200 samples. That’s a window, not a recording. To keep readings for later you want the Data Logger in lesson 8.
Naming your series
inst.plot() takes names and values:
inst.plot(inside=inside, outside=outside)
The name on the left of each = is the label in the legend. The value on the right is the reading. Choose names you’d be happy to read in a week. left_speed beats x.
You can send as many as you like in one call, and all the values in one call share the same moment in time. That’s what makes two lines comparable.
Why the auto-scale matters
Because the chart scales to fit everything, one big series flattens a small one. Plot a distance in millimetres (0 to 2000) beside a voltage (0 to 3.3) and the voltage becomes a flat line along the bottom.
There are two fixes. Plot things of a similar size together, or scale one up:
inst.plot(distance_mm=distance, volts_x500=volts * 500)
Putting the multiplier in the name keeps you honest about what the line means.
What plots are good at
| You see | It often means |
|---|---|
| A slow drift | Something warming up, or a battery running down |
| Sudden spikes | Electrical noise or a loose wire |
| A flat line | The sensor isn’t connected, or you’re reading the wrong pin |
| Steps instead of a curve | You’re reading too slowly, or the value is being rounded |
None of these are easy to spot in a column of printed numbers. All of them are obvious on a chart.
Try it Yourself
- Add a third series,
difference=inside - outside. When is it biggest? - Change
time.sleep(0.05)totime.sleep(0.5). What happens to the chart, and to the samples-per-second figure? - Multiply
outsideby 100 and watch what happens to theinsideline. Then fix it with the trick above.
Common Issues
Problem: There are extra lines called temp and light that I didn’t plot.
Solution: Ignore them, or press CLEAR. They’re the simulator’s demo data.
Why: The simulated device streams sample readings of its own. A real board doesn’t.
Problem: One of my lines is flat along the bottom. Solution: Plot it on its own, or scale it to match the others. Why: The chart scales to the biggest series, which squashes small ones.
Problem: The chart is a jagged scribble. Solution: Slow the loop down a little, or plot an average of the last few readings. Why: Real sensors are noisy. Averaging is the simplest filter there is.
Check your understanding
Quick quiz 1 of 3
In inst.plot(speed=12), what is “speed”?
Quick quiz 2 of 3
How much history does the Plotter keep?
Quick quiz 3 of 3
A sensor’s line is completely flat. What should you suspect first?
You can use the arrows ← → on your keyboard to navigate between lessons.
Comments