The Oscilloscope
Use Snakie's Oscilloscope to see a PWM signal, read its frequency, duty cycle and period, and understand how LEDs dim and servos steer
By Kevin McAleer, 5 Minutes
Page last updated November 20, 2026

Some signals change far too fast to plot point by point. For those, engineers use an oscilloscope: an instrument that draws the shape of a signal.
PWM in one paragraph
A Pico’s pins are digital. They’re on (3.3 V) or off (0 V), with nothing in between. To dim an LED or steer a servo, the Pico flicks a pin on and off very quickly. That’s PWM, pulse width modulation. Three numbers describe it:
| Number | Meaning | Example |
|---|---|---|
| Frequency | How many on-off cycles each second | 1 kHz is 1000 a second |
| Period | How long one cycle takes | 1 ms at 1 kHz |
| Duty cycle | How much of each cycle the pin is on | 50 % is half the time |
An LED at 25 % duty is on for a quarter of the time, and your eye sees it as dim.
See it
Open the Oscilloscope in the dock and run this in the full app. It steps an LED on GP15 through five brightness levels.
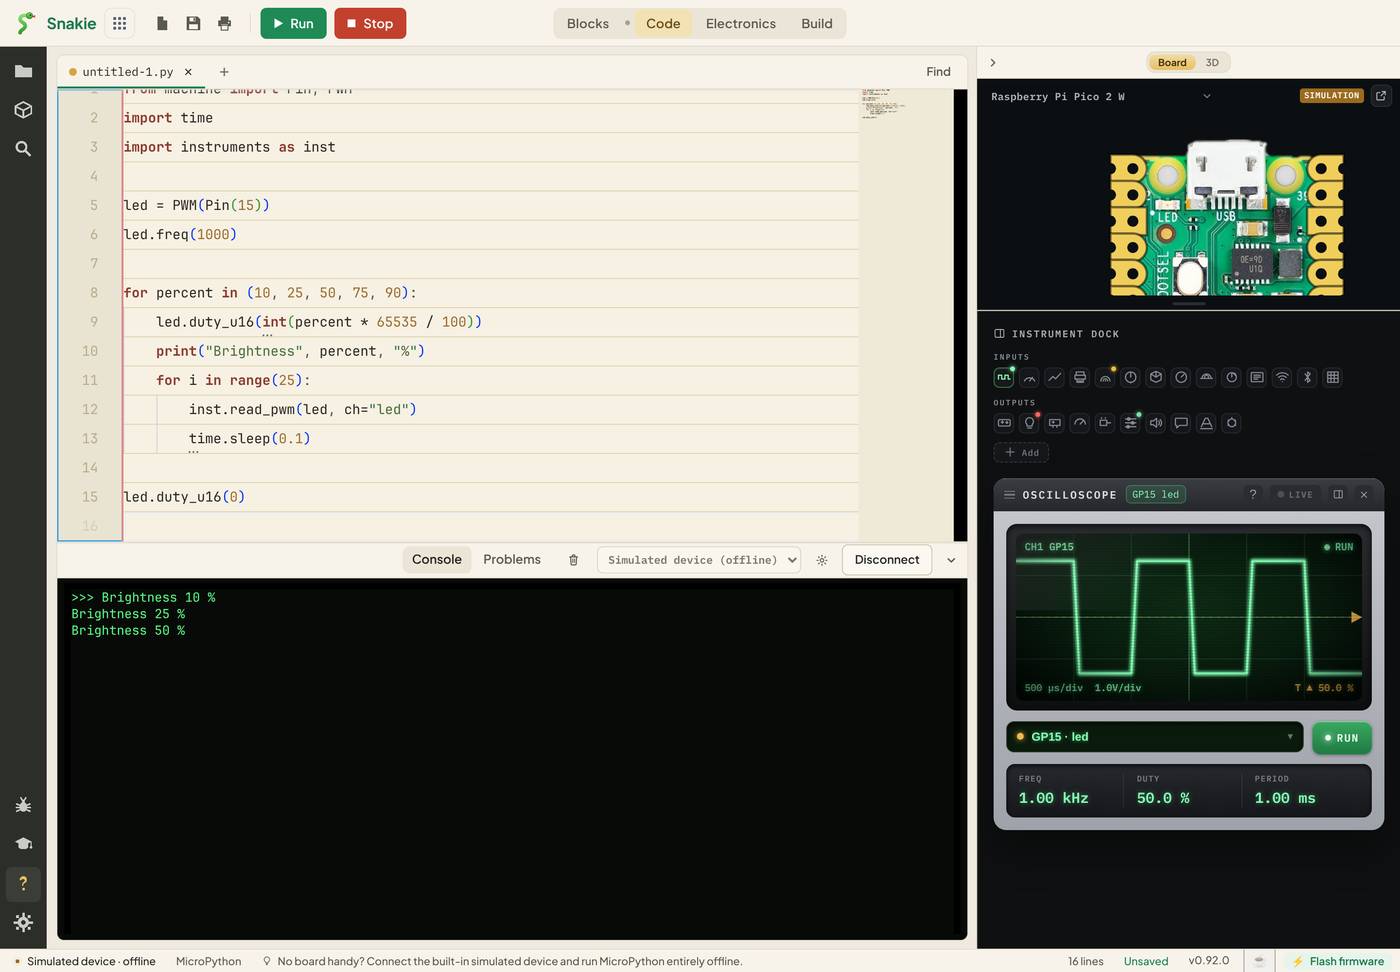
The green trace is the signal. High is on, low is off. Watch the tops of the wave get wider as the brightness climbs: thin spikes at 10 %, equal highs and lows at 50 %, almost solid at 90 %.
Reading the scope
Under the screen are three readouts:
- FREQ is the frequency. Here it’s 1.00 kHz, because of
led.freq(1000) - DUTY is the duty cycle as a percentage
- PERIOD is the time for one cycle: 1.00 ms
The selector under the screen picks which signal is shown. Ours is labelled GP15 · led: the pin it’s on, and the channel name from ch="led".
How the reading gets there
inst.read_pwm(led, ch="led") asks the PWM object for its frequency and duty and sends them to the scope. Snakie draws the wave from those two numbers.
That’s an honest thing to know about this instrument. It shows what the Pico has been told to output, which is exactly what you need for checking your code. It can’t show what a faulty wire has done to the signal further down the line. For that you need a bench oscilloscope with a real probe.
Servos are PWM too
A hobby servo listens for a pulse 50 times a second. The pulse’s width, about 0.5 ms to 2.5 ms, sets the angle. On the scope that’s a 50 Hz signal with a 20 ms period and a small duty, between about 2.5 % and 12.5 %.
So if a servo won’t move, the scope gives you a two-second test. FREQ should say 50.0 Hz. If it says 1.00 kHz, you forgot servo.freq(50).
Any waveform you like
The scope will also draw values you send it directly with inst.scope():
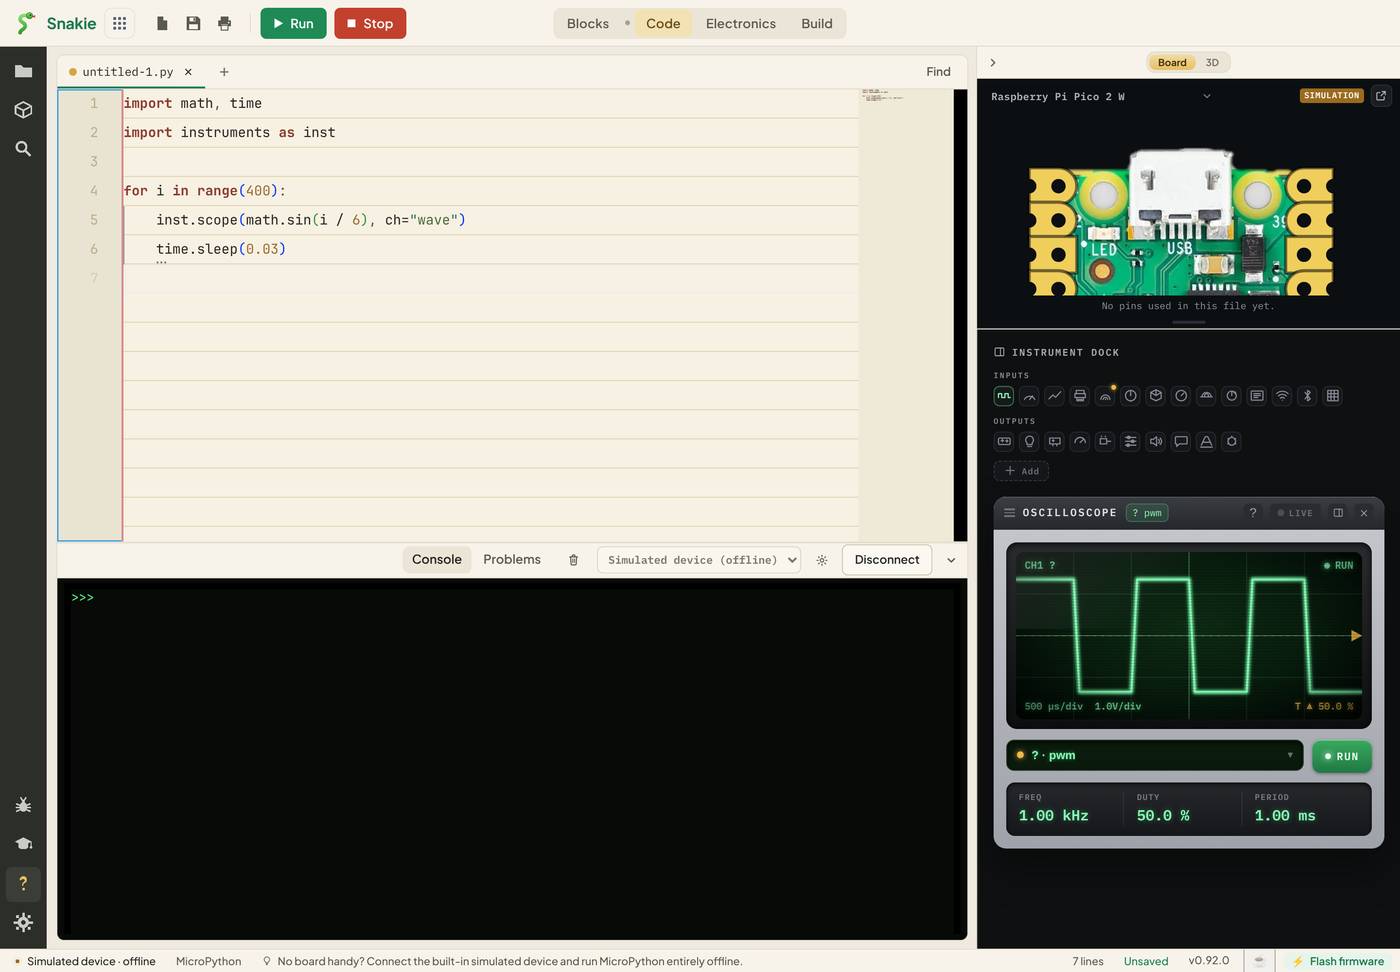
For a stream of values the readouts change to LAST, MIN and MAX.
Plotter or scope?
| Use the Plotter when | Use the Oscilloscope when |
|---|---|
| You want several named values side by side | You’re looking at one signal’s shape |
| The value changes slowly | It’s a PWM output |
| You care about the trend | You care about frequency, duty or timing |
Try it Yourself
- Change
led.freq(1000)toled.freq(500). Predict FREQ and PERIOD before you run it. - Add a brightness of
100to the list. What does the trace look like, and why? - Turn the program into a servo test:
freq(50), and duties of 1638 and 8191 withduty_u16(). Check the DUTY readout against the 2.5 % and 12.5 % above.
Common Issues
Problem: The scope shows a wave but I haven’t run my program.
Solution: Use the selector under the screen to choose your own channel once the program is running.
Why: The simulated device has demo channels called ch1 and pwm.
Problem: The trace doesn’t change when I change the duty.
Solution: Call inst.read_pwm() again after each change, or inside your loop.
Why: Each call sends one snapshot. The scope only knows what it was last told.
Problem: My LED flickers on real hardware. Solution: Check FREQ. Anything under about 100 Hz is visible to the eye. Use 1000. Why: A slow PWM is a visible blink, not a dim glow.
Check your understanding
Quick quiz 1 of 3
An LED is driven at 25 % duty. How long is the pin on for?
Quick quiz 2 of 3
What frequency does a hobby servo expect?
Quick quiz 3 of 3
What does Snakie’s scope show for a PWM pin?
You can use the arrows ← → on your keyboard to navigate between lessons.
Comments