Logging Data
Record a run with Snakie's Data Logger, tear off a CSV file, write your own log file on the board and open it as a table
By Kevin McAleer, 5 Minutes
Page last updated November 20, 2026

Instruments show you now. Sometimes you need then: a record you can study after the run, compare with yesterday’s, or put in a report.
The Data Logger
Open the Data Logger from the dock. It looks like a little dot-matrix printer, and it behaves like one.
Run the two-thermometer program from lesson 3 again, then press ● REC on the logger.
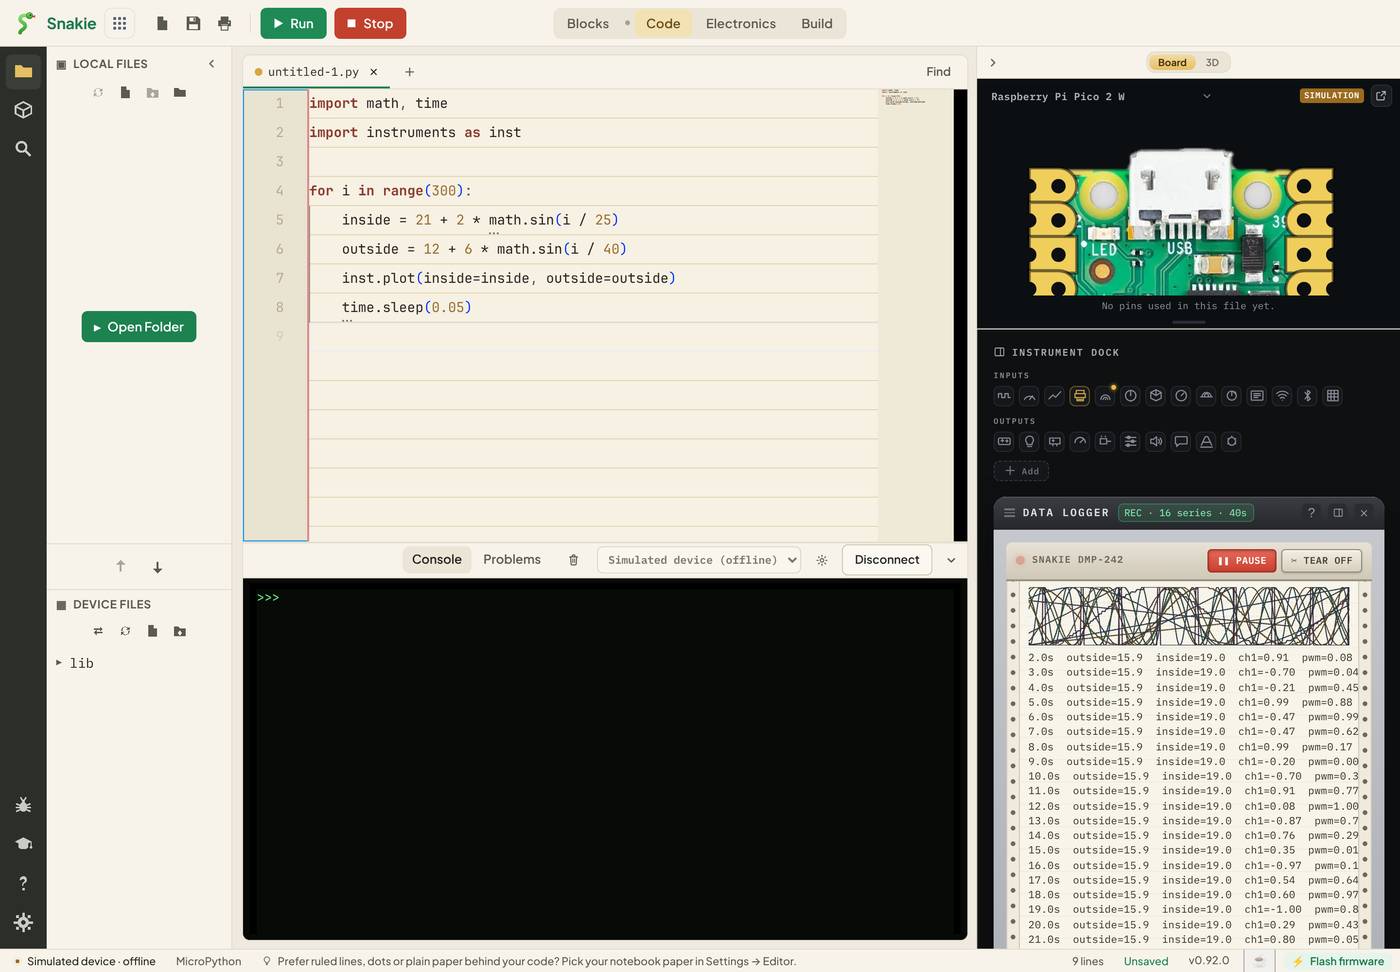
Paper feeds out of the printer. Along the top is a strip chart, and under it one row per moment with every stream’s value: outside=15.9 inside=19.0 and so on.
The logger records everything your program is sending, whichever instrument it was meant for: plotted values, meter readings and scope channels all land on the same paper. You don’t change your code at all.
| Button | What it does |
|---|---|
| ● REC | Start recording |
| PAUSE | Hold the recording without losing it |
| ✂ TEAR OFF | Save what’s on the paper as a CSV file |
Tear off a CSV
Press TEAR OFF and Snakie saves a file with a name like snakie-log-2026-11-20.csv.
CSV means comma-separated values. It’s the plainest kind of spreadsheet: one row per line, commas between the columns. The first column is time_s, the seconds since recording began, followed by a column per stream, such as plot:inside and plot:outside.
Open it in any spreadsheet program and you can chart it, average it, or compare two runs side by side.
Logging on the board itself
The Data Logger needs Snakie to be listening. A robot roaming the garden on batteries has nobody listening. For that, the program writes its own file on the board.
log = open("scan.csv", "w")
log.write("angle,volts\n")

for angle in range(0, 181, 5):
    volts = 1.5                      # your reading goes here
    log.write("%d,%.3f\n" % (angle, volts))

log.close()
Line by line:
open("scan.csv", "w")creates the file for writing. If it already exists, it’s replaced- The first
writeis the header row: the column names "%d,%.3f\n"is a template.%dis a whole number,%.3fis a number with three decimal places, and\nends the linelog.close()finishes the file. Don’t skip it. Until the file is closed, some of your data may not be saved
You’ll run this for real in the project in the next lesson.
Reading the file back
When the program finishes, the file appears under DEVICE FILES on the left of the Code workspace.
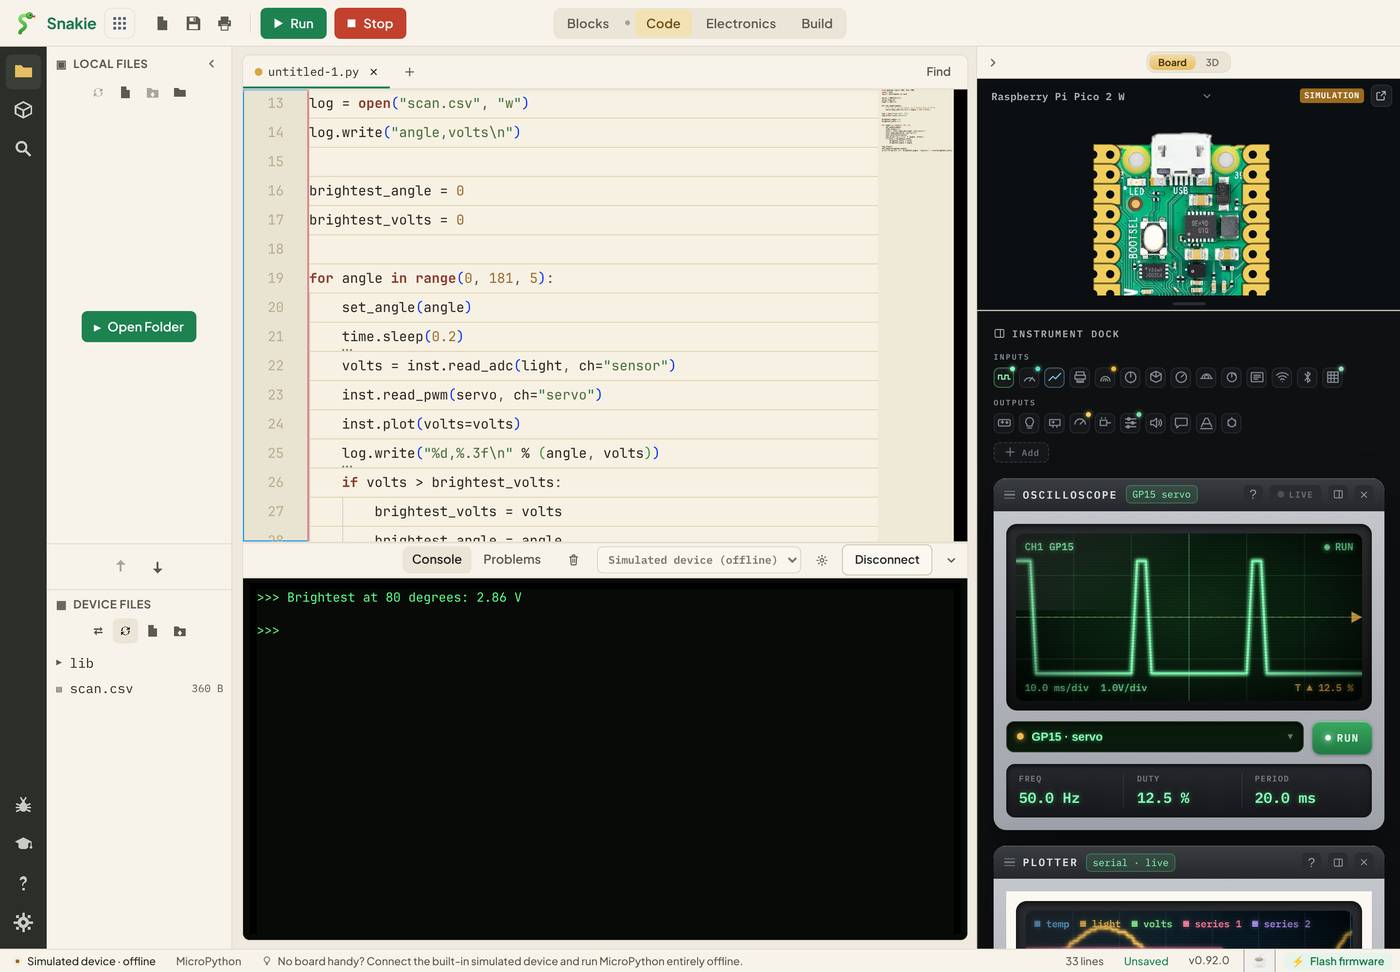
Double-click it. Snakie doesn’t show you raw text. It opens a Data View: a proper table.
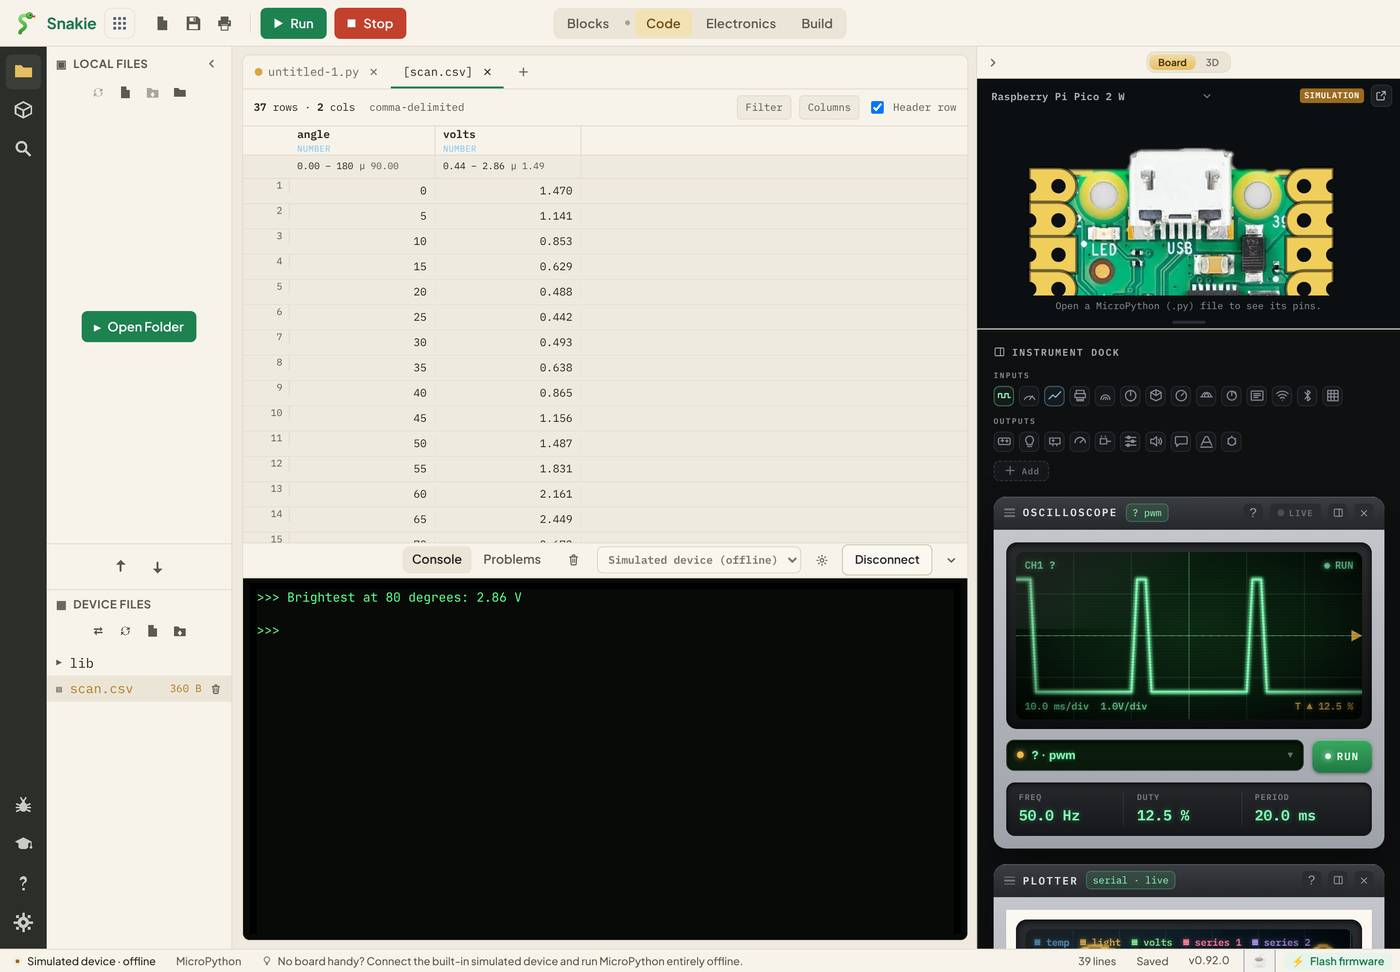
The top line tells you the size (37 rows · 2 cols). Each column header shows its type and, for numbers, the lowest and highest value and the mean. Filter narrows the rows, and Columns hides the ones you don’t need.
Those column summaries answer a lot of questions before you’ve opened a spreadsheet. What was the brightest reading? Look at the top of the volts column.
Which kind of log?
| Data Logger | A file on the board | |
|---|---|---|
| Code needed | None | A few lines |
| Works without a computer attached | No | Yes |
| What’s recorded | Every telemetry stream | Exactly what you write |
| Where it’s saved | Your computer | The board |
Try it Yourself
- Record ten seconds of the lesson 3 program and tear off the CSV. How many columns does it have, and why are there more than two?
- Press PAUSE part-way through a run, then carry on. What does the paper show?
- Change
%.3fto%.1fin the file example. What would the rows look like?
Common Issues
Problem: My CSV has columns I didn’t send, like plot:temp.
Solution: Ignore or delete them. They’re the simulator’s demo streams.
Why: The logger records every stream it hears, and the simulated device has some of its own.
Problem: My file on the board is empty, or the last rows are missing.
Solution: Make sure log.close() runs, even if the loop ends early.
Why: Writes are held in memory and only fully saved when the file is closed.
Problem: Each run wipes out the last file.
Solution: Open with "a" to append, or use a new file name each time.
Why: "w" always starts a fresh file.
Check your understanding
Quick quiz 1 of 3
What does the Data Logger record?
Quick quiz 2 of 3
Why would you write a log file on the board instead?
Quick quiz 3 of 3
What happens if you forget log.close()?
You can use the arrows ← → on your keyboard to navigate between lessons.
Comments